原文链接:http://www.juzicode.com/archives/3139
错误提示:
pyplot.hist()绘制直方图时提示:ValueError: x must have 2 or fewer dimensions
#juzicode.com,#VX:桔子code
import numpy as np
import matplotlib.pyplot as plt
plt.rc('font',family='Youyuan',size='9')
plt.rc('axes',unicode_minus='False')

a = np.random.randn(2000,2,3)
print('a.shape=',a.shape)
plt.hist(a,bins=50)
plt.title('正态分布 by桔子code')
plt.show()
---------------------------------------------------------------------------
ValueError Traceback (most recent call last)
<ipython-input-60-e1963ebdf16f> in <module>
7 a = np.random.randn(2000,2,3)
8 print('a.shape=',a.shape)
----> 9 plt.hist(a,bins=50)
10 plt.title('正态分布 by桔子code')
11 plt.show()
d:\python\python38\lib\site-packages\matplotlib\pyplot.py in hist(x, bins, range, density, weights, cumulative, bottom, histtype, align, orientation, rwidth, log, color, label, stacked, data, **kwargs)
2683 orientation='vertical', rwidth=None, log=False, color=None,
2684 label=None, stacked=False, *, data=None, **kwargs):
-> 2685 return gca().hist(
2686 x, bins=bins, range=range, density=density, weights=weights,
2687 cumulative=cumulative, bottom=bottom, histtype=histtype,
d:\python\python38\lib\site-packages\matplotlib\__init__.py in inner(ax, data, *args, **kwargs)
1445 def inner(ax, *args, data=None, **kwargs):
1446 if data is None:
-> 1447 return func(ax, *map(sanitize_sequence, args), **kwargs)
1448
1449 bound = new_sig.bind(ax, *args, **kwargs)
d:\python\python38\lib\site-packages\matplotlib\axes\_axes.py in hist(self, x, bins, range, density, weights, cumulative, bottom, histtype, align, orientation, rwidth, log, color, label, stacked, **kwargs)
6569
6570 # Massage 'x' for processing.
-> 6571 x = cbook._reshape_2D(x, 'x')
6572 nx = len(x) # number of datasets
6573
d:\python\python38\lib\site-packages\matplotlib\cbook\__init__.py in _reshape_2D(X, name)
1370 return [np.reshape(x, -1) for x in X]
1371 else:
-> 1372 raise ValueError(f'{name} must have 2 or fewer dimensions')
1373
1374 # Iterate over list of iterables.
ValueError: x must have 2 or fewer dimensions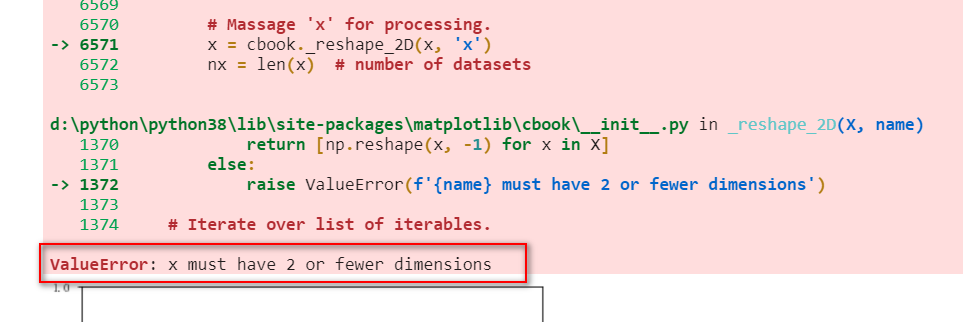
错误原因:
1、pyplot.hist()传入的numpy数组维数不能大于2。
解决方法:
1、a = np.random.randn(2000,2,3)构造的数组是3维的,将第3维拆分,这个例子中第3维的数值为3,可以拆分为3个二维数组:
#juzicode.com,#VX:桔子code
import numpy as np
import matplotlib.pyplot as plt
plt.rc('font',family='Youyuan',size='9')
plt.rc('axes',unicode_minus='False')

a = np.random.randn(2000,2,3)
print('a.shape=',a.shape)
plt.subplots_adjust(wspace=0.2, hspace=0.5)
plt.subplot(221)
plt.title('a[:,:,0]')
plt.hist(a[:,:,0],bins=50)
plt.subplot(222)
plt.title('a[:,:,1]')
plt.hist(a[:,:,1],bins=50)
plt.subplot(223)
plt.title('a[:,:,2]')
plt.hist(a[:,:,2],bins=50)
plt.show()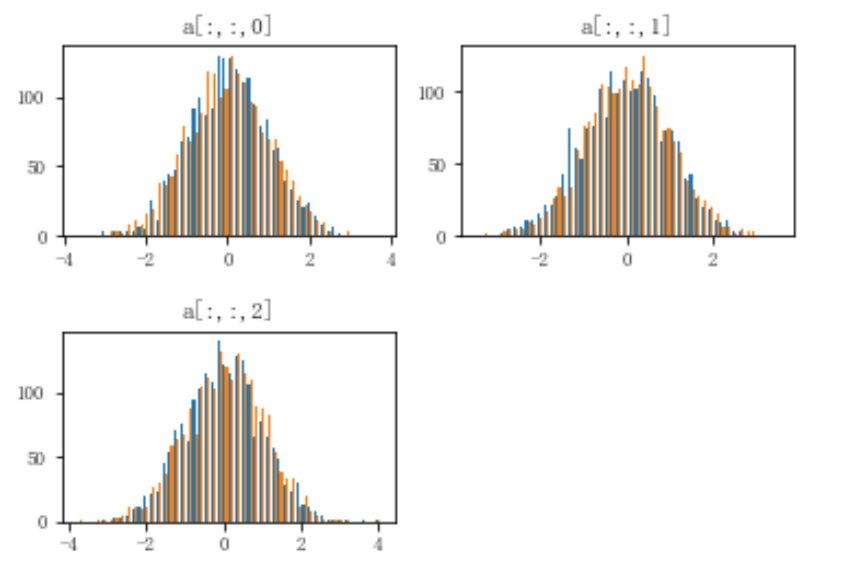
相关阅读:
数据可视化~matplotlib基本绘图方法
数据可视化~matplotlib显示多个子图
关注微信公众号:“桔子code”,欢迎后台留言撩我,我会尽我所能为你解惑Python,C等编程知识