原文链接:http://www.juzicode.com/python-error-matplotlib-pyplot-bar-height-wrong/
错误提示:
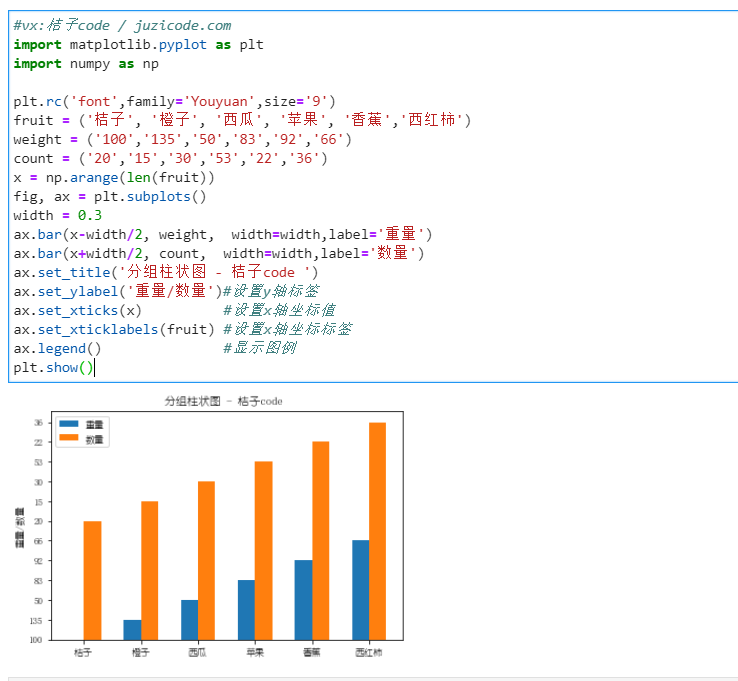
matplotlib.pyplot绘制bar型图,显示的柱高与实际数据不符:
#vx:桔子code / juzicode.com
import matplotlib.pyplot as plt
import numpy as np

plt.rc('font',family='Youyuan',size='9')
fruit = ('桔子', '橙子', '西瓜', '苹果', '香蕉','西红柿')
weight = ('100','135','50','83','92','66')
count = ('20','15','30','53','22','36')
x = np.arange(len(fruit))
fig, ax = plt.subplots()
width = 0.3
ax.bar(x-width/2, weight,  width=width,label='重量')
ax.bar(x+width/2, count,  width=width,label='数量')
ax.set_title('分组柱状图 - 桔子code ')
ax.set_ylabel('重量/数量')#设置y轴标签
ax.set_xticks(x)          #设置x轴坐标值
ax.set_xticklabels(fruit) #设置x轴坐标标签
ax.legend()               #显示图例
plt.show()
运行结果:
错误原因:
1、weight和count使用的是字符串型变量,不是int型数值。
weight = (‘100′,’135′,’50’,’83’,’92’,’66’)
count = (’20’,’15’,’30’,’53’,’22’,’36’)
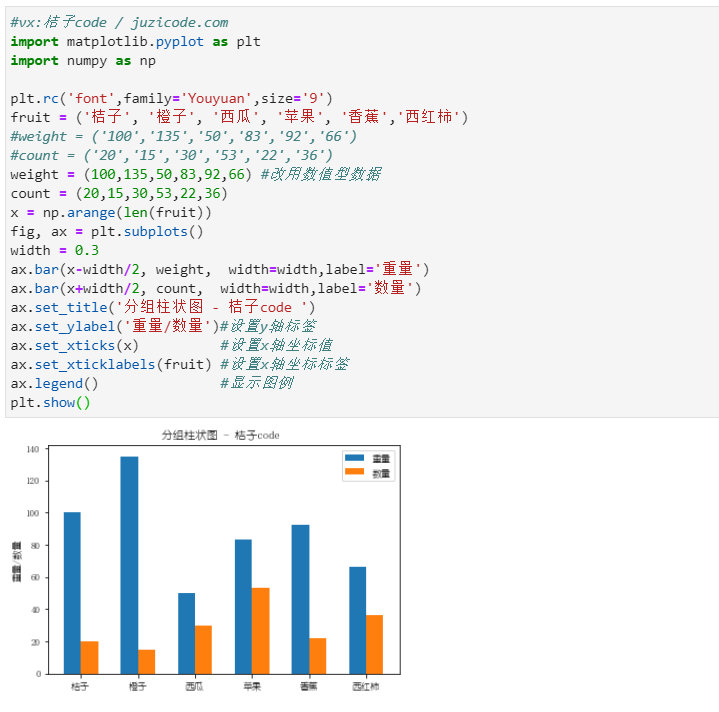
解决方法:
1、将weight和count修改为int型数值
#vx:桔子code / juzicode.com
import matplotlib.pyplot as plt
import numpy as np

plt.rc('font',family='Youyuan',size='9')
fruit = ('桔子', '橙子', '西瓜', '苹果', '香蕉','西红柿')
#weight = ('100','135','50','83','92','66')
#count = ('20','15','30','53','22','36')
weight = (100,135,50,83,92,66) #改用数值型数据
count = (20,15,30,53,22,36)
x = np.arange(len(fruit))
fig, ax = plt.subplots()
width = 0.3
ax.bar(x-width/2, weight,  width=width,label='重量')
ax.bar(x+width/2, count,  width=width,label='数量')
ax.set_title('分组柱状图 - 桔子code ')
ax.set_ylabel('重量/数量')#设置y轴标签
ax.set_xticks(x)          #设置x轴坐标值
ax.set_xticklabels(fruit) #设置x轴坐标标签
ax.legend()               #显示图例
plt.show()
运行结果:
扩展内容:
如果本文还没有完全解决你的疑惑,你也可以在微信公众号“桔子code”后台给我留言,欢迎一起探讨交流。